Flowcharts are visual representations of processes and workflows and powerful tools for anybody trying to plan, visualize, and communicate.
With efficiency at their heart, they help you brainstorm and work together by simplifying complex information. They’re also key in decision-making and problem-solving, helping you to easily see different outcomes at once.
In this guide, we explore how to make a flowchart, looking at the different types of flowcharts that are best suited for different scenarios and the tools you can use to make them.
Different types of flowcharts
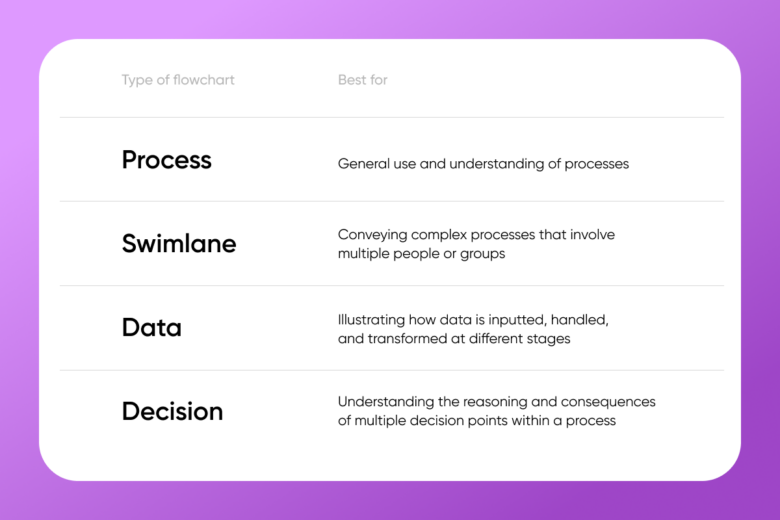
To understand how to make a flowchart you need to know which style and templates to use. Here’s an outline of the four main types followed by a description of each.

- Process flowcharts: One of the most popular flowcharts, process flowcharts illustrate the sequences of a process step-by-step. They’re common in business workflows where you need to identify areas for improvement and optimization.
- Swimlane flowcharts: Also known as cross-functional flowcharts, swimlane flowcharts involve different sections (or ‘swimlanes’) that show how different roles interact with each stage of a process. This makes it easy to visualize different people’s responsibilities and work together.
- Data flowcharts: Also known as data flow diagrams (DFDs), data flowcharts are like maps that show you how data moves through a process or system. Though they’re most often used in fields like business process management, they also have more general use cases such as budgeting.
- Decision flowcharts: Decision flowcharts illustrate decision-making processes and help you visualize the different choices at each point in a process. Each point typically branches into two or more options; this makes them great for situations where there are multiple paths to consider.
A step-by-step guide on how to make a flowchart
Want to know the best way to make a flowchart? Just ask yourself these three questions.

What is the purpose of my flowchart?
Are you documenting a process or making a decision about a new one? Do you need to analyze data or troubleshoot problems? Use our table above to find the type of flow chart that best suits your purpose!
Who’s my audience?
Think about who you are creating the flowchart for. If it’s someone who regularly sees flowcharts, you can make your design a little more complex with extra steps and text. If, on the other hand, your audience isn’t from a data-driven background, keep it simple.
What’s the right tool for the job?
Creating the perfect flowchart design doesn’t need to involve expensive software or a steep learning curve, but there are a few key features you should look for…
First and foremost: the software should be easy to use. Intuitive infographic tools will allow you to create quickly without wasting learning how to use the software. Look for functionality like drag-and-drop to make visualizing easier.
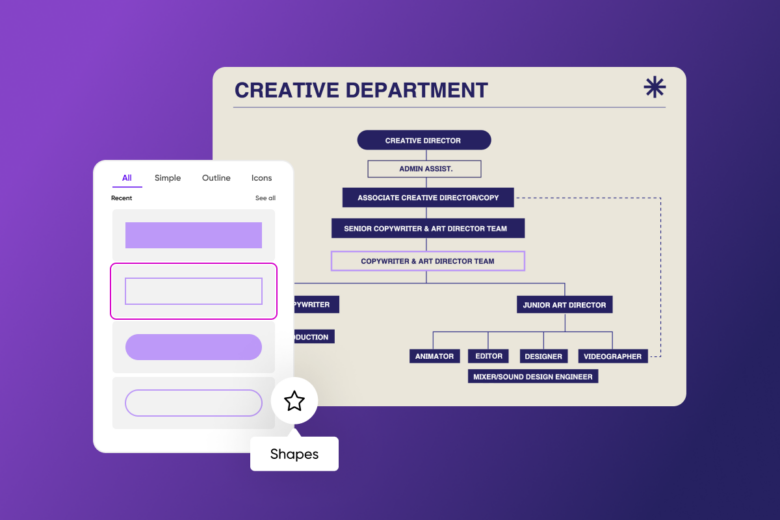
You also need a tool with a good amount of customization with a huge range of shapes, symbols, and colors. This will let you format your flowcharts in line with your personal preferences as well as any company branding.
The best tools will also have templates to quickly make multiple flowchart designs in a consistent palette and theme. Look out, too, for export options so you can easily share your finished product in multiple formats for different use cases.
Thankfully, Picsart’s easy-to-use flowchart tool has all of this and more!
In the next section, we’ll show you how to make a flowchart that will wow your audience.
How to create a flowchart with Picsart
Here’s how to make a flowchart in easy steps on both the web editor and on mobile app! You can also start by scratch by opening up a blank canvas inside Picsart’s Photo Editor and adding symbols, graphics, and text.
 How to make a flowchart that looks cool
How to make flowcharts: Flowchart design on the web:
1) Open the Picsart web editor and start a new project.
2) Select templates in the left panel toolbar and search for “Flowchart.” Choose the style that best fits your project.
3) Add the different sections of the flowchart using the “Text,” “Stickers,” and “Elements” tools on the right panel.
4) Optional: choose your company’s brand color palette. And if you don’t know what this is, find it in seconds with our color palette from an image tool!
5) When you’re finished with your flowchart, click on “Export” to download and save your flowchart design. Here you can also name the file, change the file format, and upscale if needed for printing.
How to make flowchart designs on mobile:
1) Open the Picsart app and tap on the plus sign (+) to start a new project.
2) Use the templates tab to search for templates or select a layout preset for your flowchart.
3) Use the tools in the editor toolbar to add shapes, text, and stickers.
4) When done, tap next then save and share your final design.
And finally, don’t be afraid to experiment! With Picsart’s easy photo editor, if you can imagine it, you can create it.


