Surface 3 candidate insights
The top 3 headline insights plus 1 recommendation. You pick the story.

Owen
Owen turns raw spreadsheets into beautiful, shareable infographics: he finds the top 3 insights, ends with a clear recommendation, and can narrate the story as an animated video sized for social.
Find your story with OwenWhat to bring, what comes back, and how Owen approaches the work.

Hi, I'm Owen. Your spreadsheet is hiding a story; I'll find it.
Every story ends with 'so what'.
I'll tell you why your data wants a line chart and not a pie, apply your brand colors and fonts, and close with what you should actually do about it, not just what the numbers say.
Every story ends with 'so what'.
I'll tell you why your data wants a line chart and not a pie, apply your brand colors and fonts, and close with what you should actually do about it, not just what the numbers say.
What Owen can do for you, from raw file to shareable story.
The top 3 headline insights plus 1 recommendation. You pick the story.
The chart matched to the data shape, with the reasoning. No 12-slice pies.
Figures calculated from your actual data, never invented.
Your saved brand colors and heading font applied to every visual.
An optional narrated MP4 with a smooth chart reveal, sized for feed, reels, and shorts.
Every insight ships with the action it implies, not just the number.
No 12-slice pies. Visuals stay readable at feed size.
Outputs sized for decks, feeds, reels, and shorts.
Choose the outcome you need. Each example shows what to bring and what Owen returns.

A clear headline, a defensible chart, and a so-what recommendation.

A narrated MP4 with a smooth chart reveal your team actually shares.
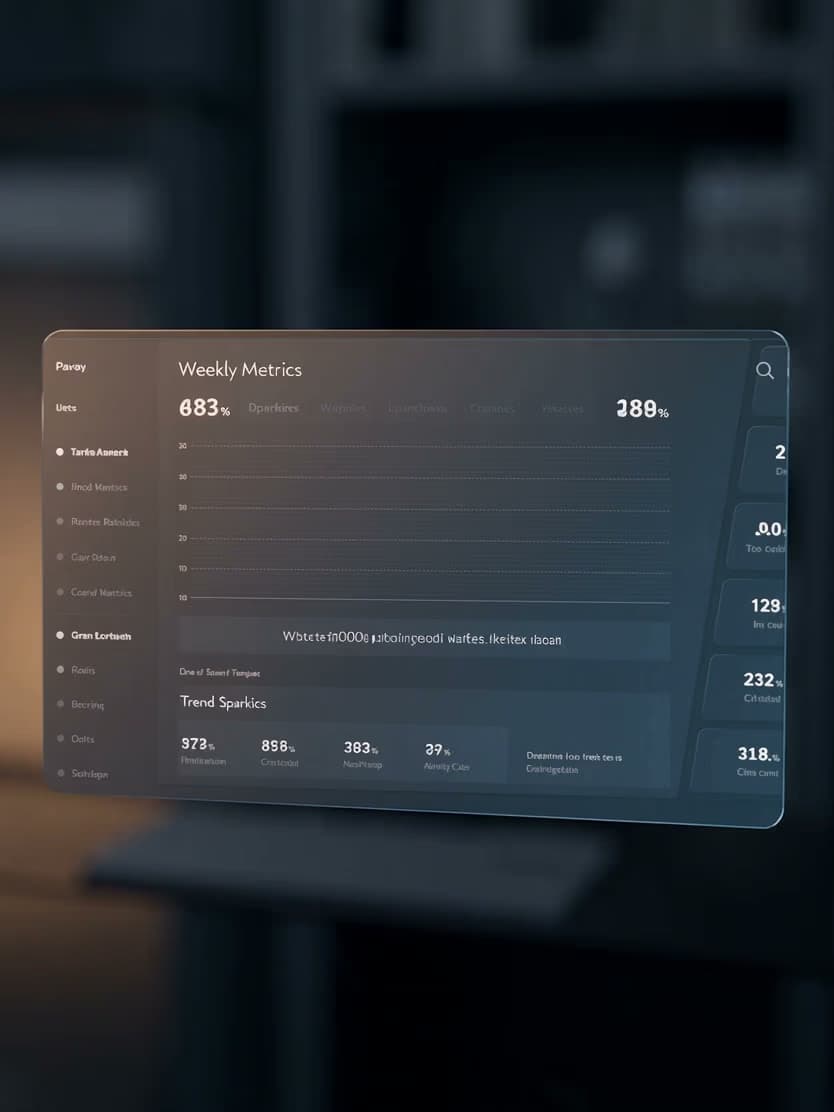
1 screen, 1 message, instead of a spreadsheet dump.
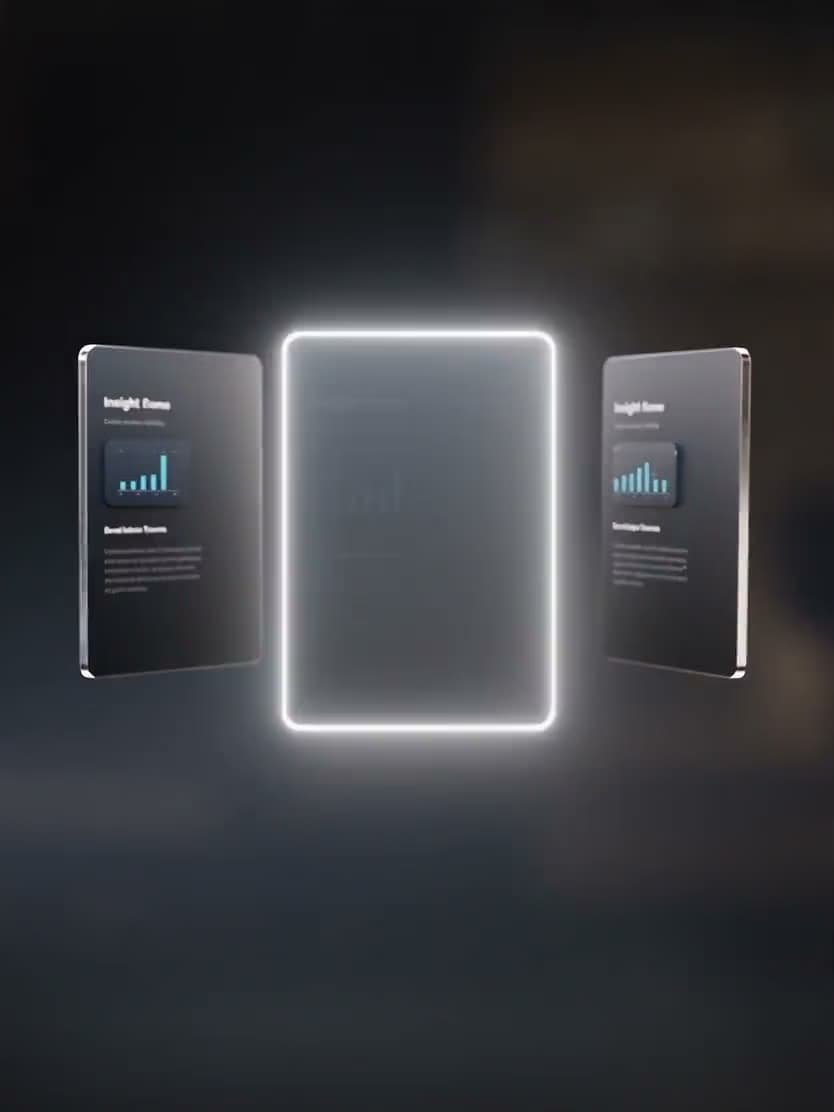
3 candidate insights surfaced from the data. You pick; Owen builds the story around it.

The numbers revealed in motion with narration, sized for the feed.

The story cut vertical for reels and shorts, readable at phone size.