How to create data infographics with Picsart Flow

What you'll learn
What is Picsart Flow?
Common use cases
Create your data infographic step by step
STEP 1: Open Flow and upload data
- On web: Go to picsart.com/flow → Create new workflow → Upload your CSV or spreadsheet
- On mobile: Open Picsart → Flow tab → "+" → Import data file from device
STEP 2: Configure chart type and style
Select how you want to visualize your data:
- Bar chart: Compare quantities across categories or time periods
- Line graph: Show trends and changes over time with continuous data
- Pie chart: Display proportions and percentage breakdowns
- Data table: Present precise numbers in a formatted grid layout
- Custom layout: Combine multiple chart types with text annotations
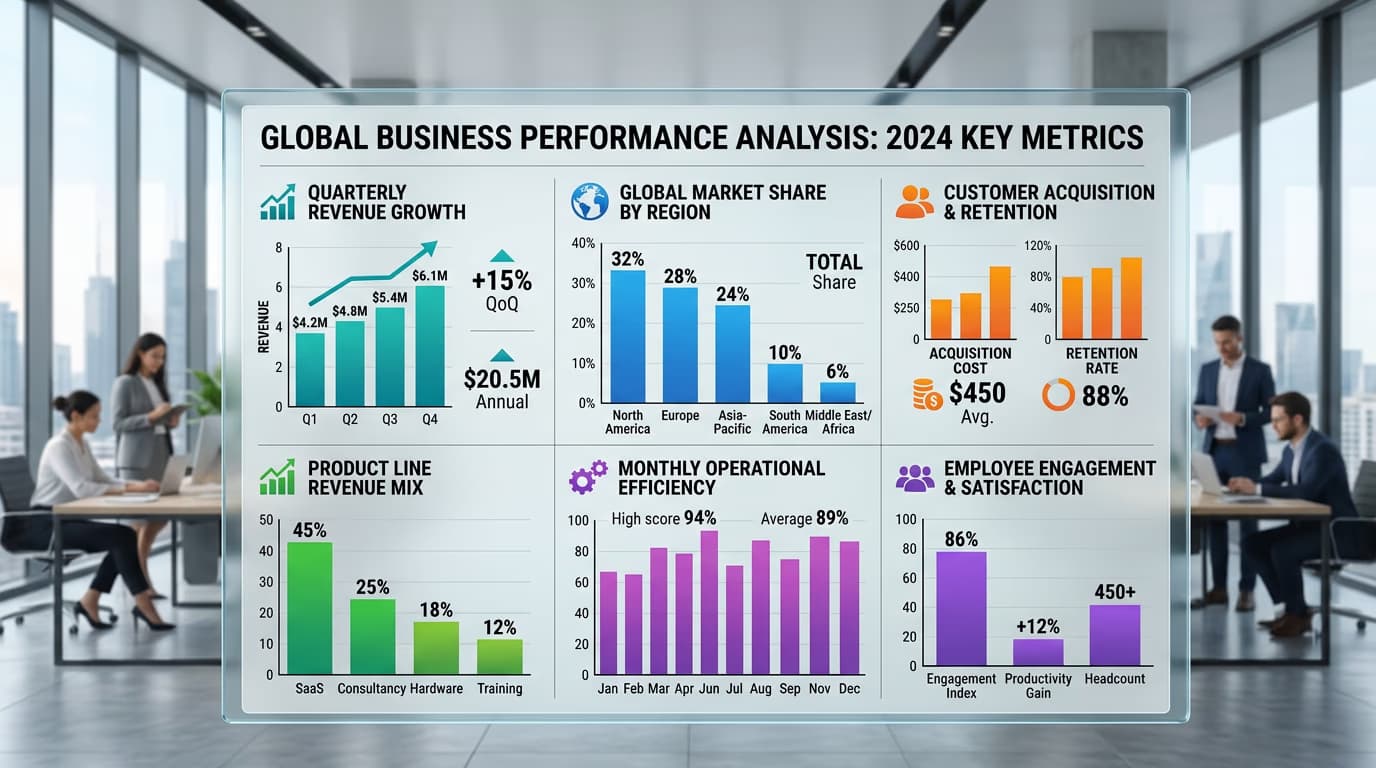
STEP 3: Apply design and verify data
Flow automatically generates your infographic layout. Review each data point, verify every statistic matches your source file, and add a citation line crediting where the data came from.
STEP 4: Review and export
Check that your infographic is accurate and readable: Not perfect? Adjust colors or chart types in the workflow, then regenerate for instant updates across all data points.
- Verify all numbers match your original source exactly
- Check that labels are clear and charts use distinct colors
- Confirm your data source citation is visible and properly formatted
Tips for best results
💡 Use owned or public-domain data only
Never visualize proprietary data you don't have rights to use. Stick to your own research, publicly released government statistics, or datasets with clear usage licenses.
💡 Always cite your source
Add a small text line at the bottom of every infographic stating where the data came from and when it was collected. This builds trust and helps viewers verify your claims.
💡 Test with small datasets first
Start with 5-10 data points to make sure your workflow is set up correctly. Once you've verified the output, scale up to larger datasets with confidence.
💡 Keep chart types simple
Bar charts and line graphs are easier to read than complex visualizations. If a viewer needs more than five seconds to understand your chart, simplify it.
Frequently asked questions

Ready to automate?
Turn data into visuals with Picsart Flow's automated design workflows.
Start creating now